product designer & creative technologist
driven by visual craft and how design shapes the way people move through the world.
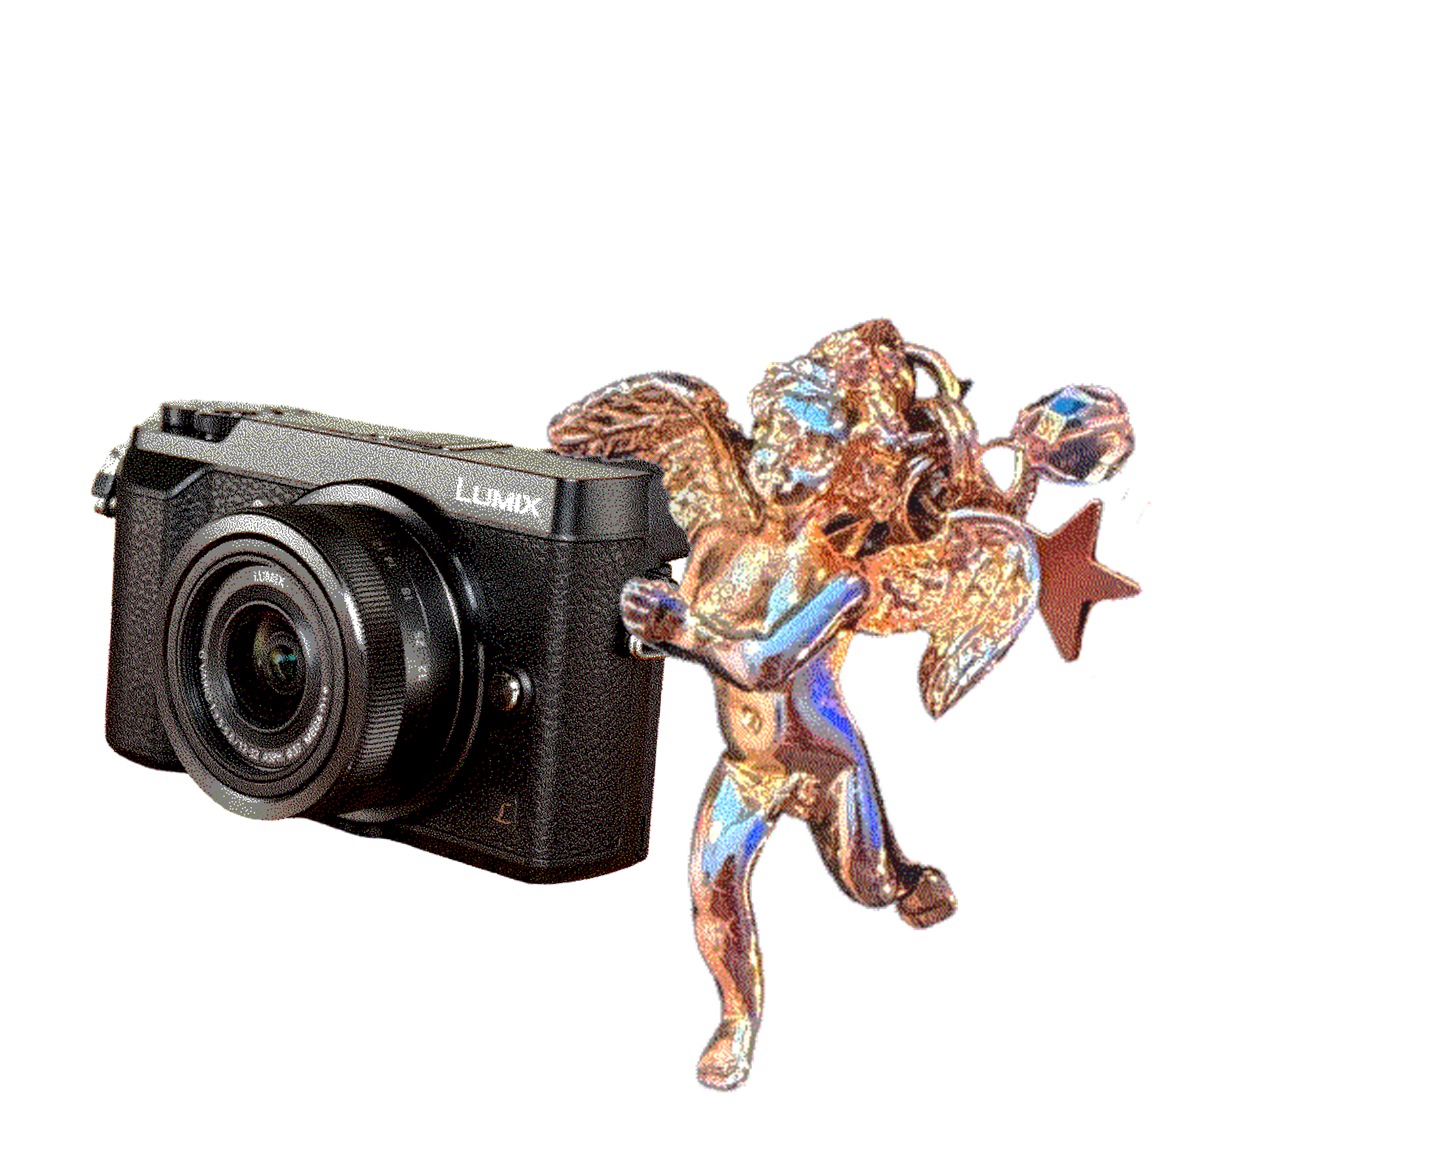
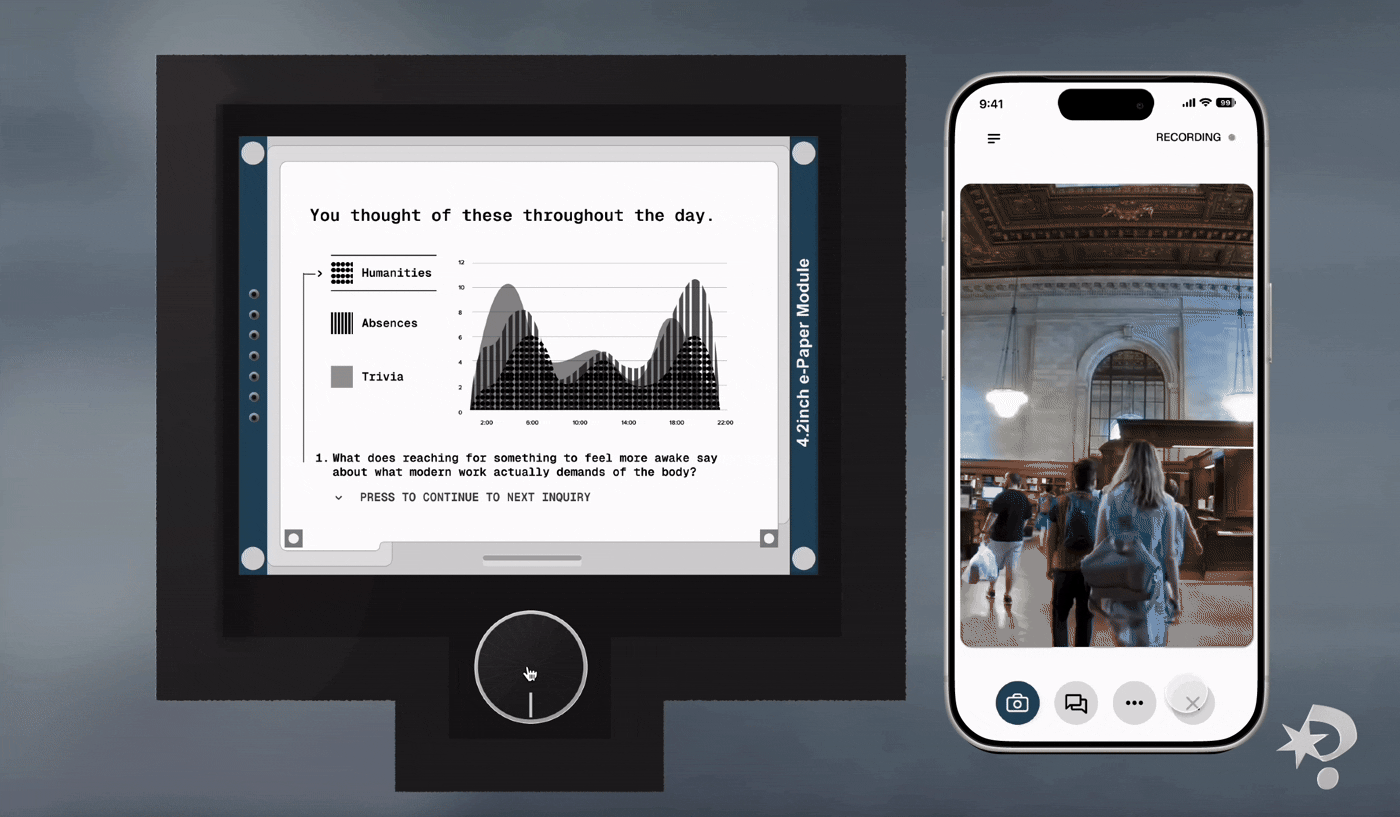
A clip-on camera + Anthropic-powered wearable that asks better questions instead of giving answers — designed to cultivate curiosity, not replace it.
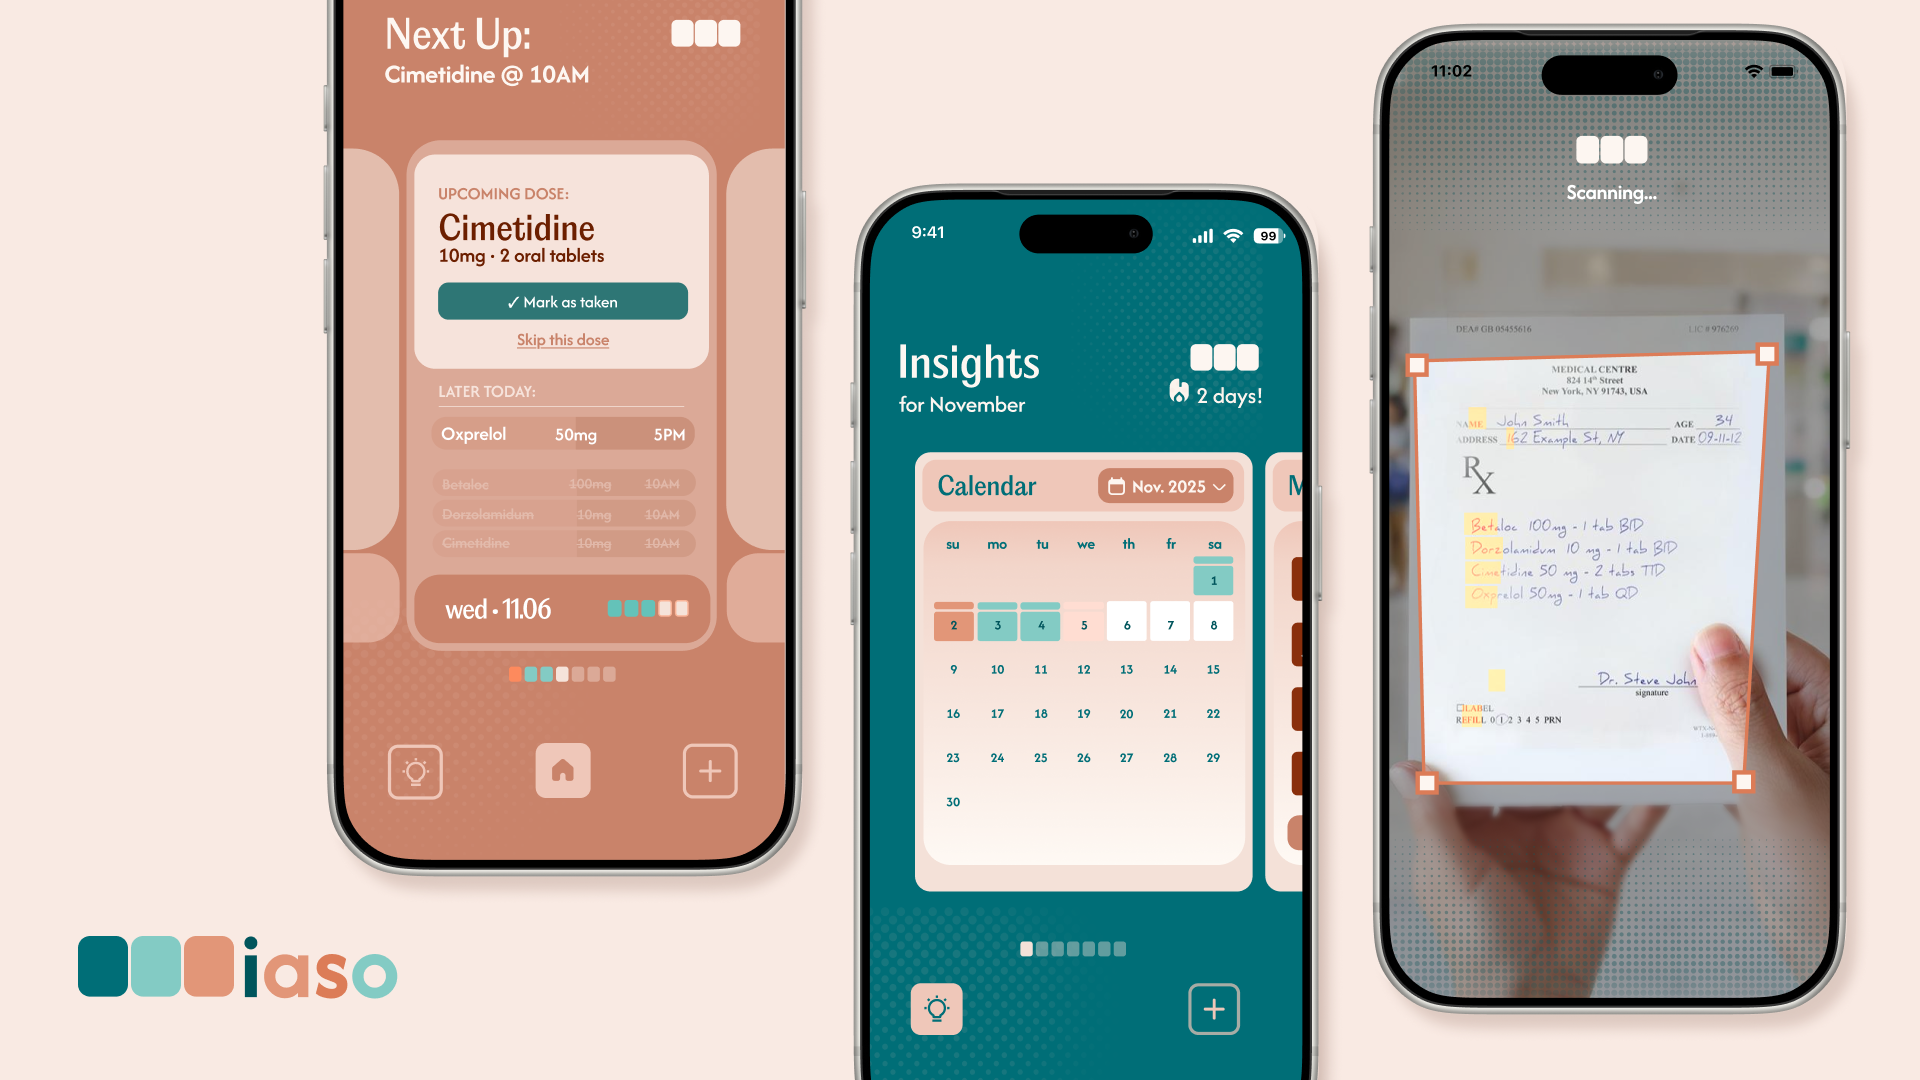
A digital pillbox that earns long-term trust — prescription scanning, GPS-based reminders, and a caregiver platform built into a consumer iOS app.
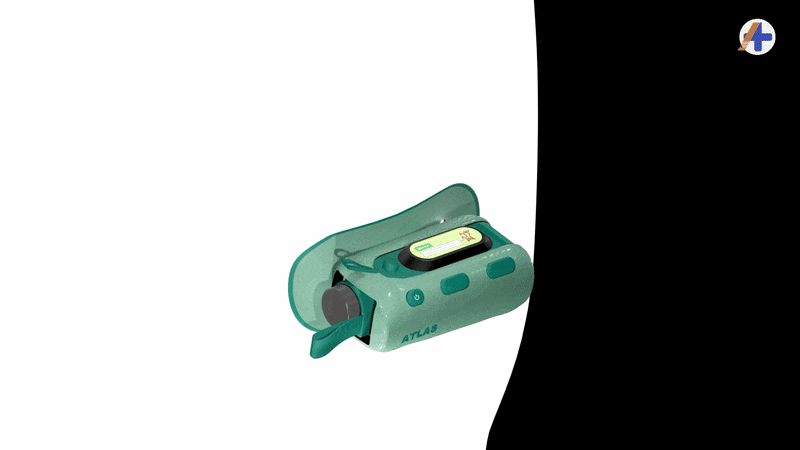
A modular on-body drug delivery ecosystem — device, smartwatch, and home hub — for the Sanofi–IDEO Device Innovation Challenge.
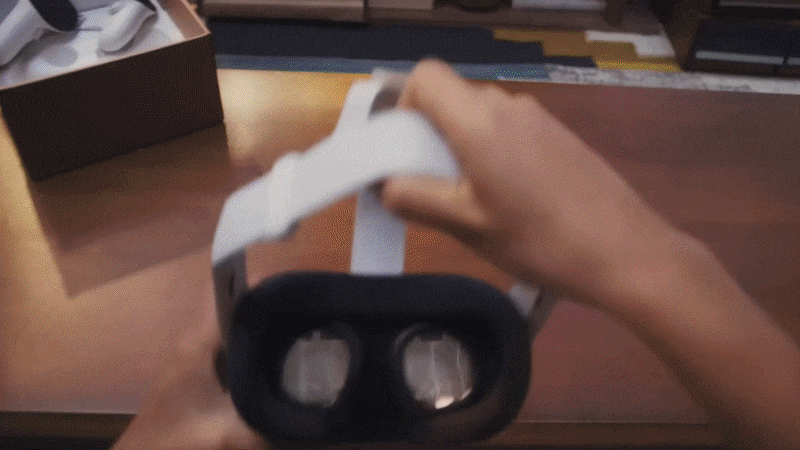
Founder's Lab Award winner. Designed the UX for an AI world-generation system driven by neural feedback.
B2B SaaS platform — full case study in progress.